
ENEE.IO vs Traditional Energy Management: What’s the Difference?
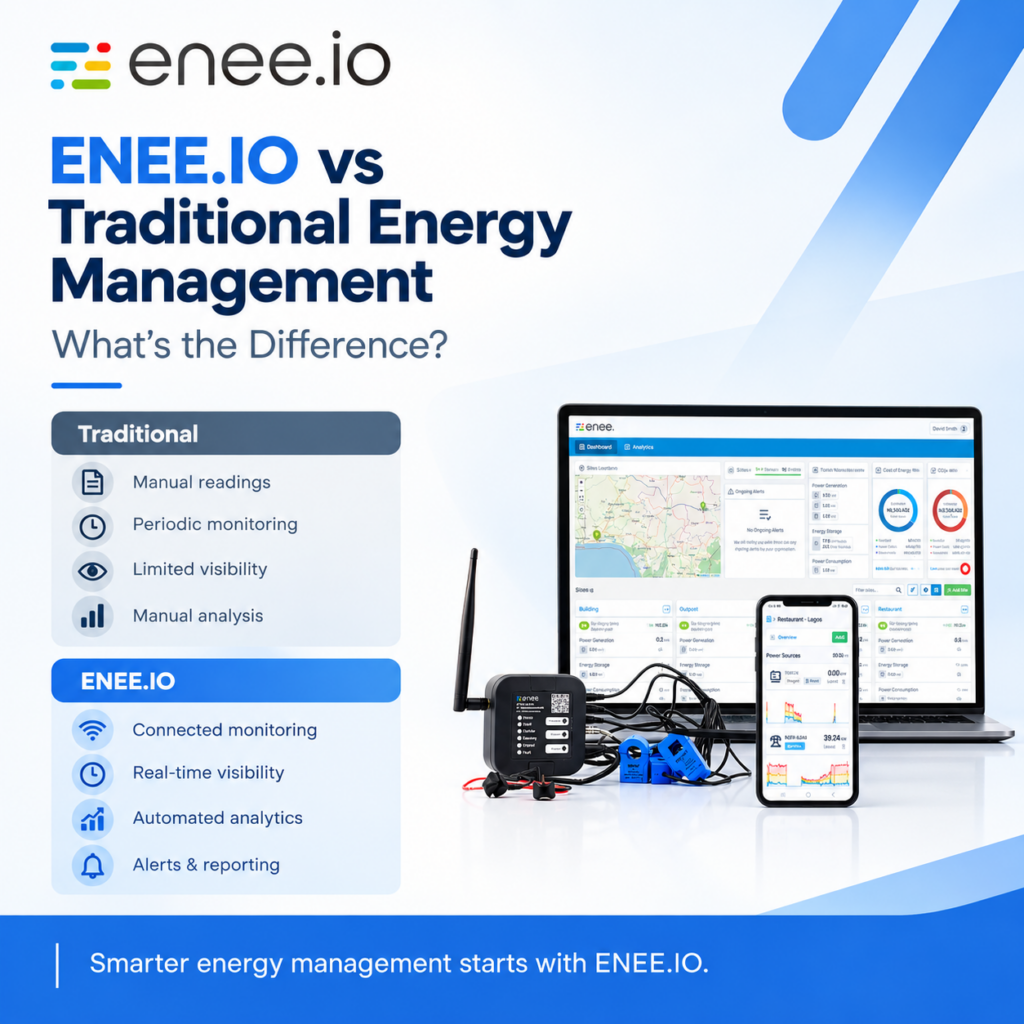
Energy management has traditionally depended on electricity bills, manual meter readings, spreadsheets, periodic inspections, and information collected from individual energy assets.
These methods can provide useful historical information, but they often make it difficult to see what is happening across an energy system in real time.
Modern energy management is increasingly moving toward connected monitoring systems that collect data directly from energy assets and make that information available through digital dashboards and analytics.
This is where ENEE.IO takes a different approach.
ENEE.IO combines plug-and-play monitoring hardware with cloud-based reporting, mobile applications, analytics, alerts, and multi-site energy management. Its system is designed to monitor different types of energy assets—including generators, batteries, inverters, and grid supply—regardless of their age, make, or model.
The result is a shift from periodic energy reporting to continuous energy intelligence.
1. Traditional Energy Management: The Conventional Approach
In a traditional setup, an organization may collect energy information through utility bills, manual meter readings, generator logs, fuel records, or spreadsheets.
For example, a facility manager might record an electricity meter reading at the beginning and end of a month:
Opening reading: 125,400 kWh
Closing reading: 132,850 kWh
Consumption: 7,450 kWh
This provides the total amount of electricity consumed during the period. However, it does not necessarily explain:
- When the energy was consumed
- Which energy source supplied it
- How much energy came from the grid
- How much came from a generator or solar system
- What the site’s demand pattern looked like
- When an abnormal event occurred
- Whether an energy asset was operating inefficiently
Additional investigation may therefore require manual records from different systems.
For businesses operating multiple sites, this process can become increasingly difficult to manage.
2. The Problem With Relying Only on Historical Data
A utility bill is fundamentally a historical record.
It tells an organization what it was charged for during a billing period, but it provides limited operational visibility into what happened throughout that period.
Consider a business that discovers its monthly energy cost has increased by 20%.
The traditional approach may require the energy manager to investigate manually:
Was the grid unavailable more frequently?
Did generator runtime increase?
Did fuel consumption increase?
Did the site experience higher demand?
Was an inverter or battery operating differently?
Was equipment left running unnecessarily?
Without sufficiently detailed operational data, answering these questions can be difficult.
ENEE.IO is designed to provide that additional layer of visibility by collecting data from energy systems and making it available through its monitoring and reporting platform.
3. How ENEE.IO Works
ENEE.IO uses a combination of smart monitoring sensors and a data gateway to collect information from energy assets.
Its hardware ecosystem includes eMB smart sensors and the eDGe Data Gateway.
The eDGe gateway collects data from connected AC and DC sensors and transmits the information to ENEE.IO’s cloud platform. The gateway supports wired and wireless monitoring configurations and can communicate using built-in 4G or Wi-Fi. It also includes local data storage and battery backup.
The basic architecture can therefore be represented as:
Energy Assets → Sensors → eDGe Gateway → Cloud Platform → Dashboard & Analytics
This creates a digital connection between physical energy infrastructure and the information used to manage it.
4. Monitoring More Than Just Electricity Consumption
One of the key differences between ENEE.IO and a basic manual monitoring process is the breadth of energy-system information that can be collected.
ENEE.IO is designed to monitor different energy assets, including:
- Generators
- Batteries
- Inverters
- Grid supply
- Solar and other distributed energy systems
The platform is also designed to be vendor-agnostic, meaning its monitoring system can work across different makes, models, and ages of energy assets.
This is particularly relevant for businesses operating hybrid energy systems.
For example, a site may use:
Grid + Generator + Solar + Battery Storage
Instead of managing information from each component separately, ENEE.IO can provide a centralized view of the site’s energy system
5. Real-Time Energy Visibility
Traditional energy management often involves collecting information periodically.
ENEE.IO provides a different model: continuous monitoring and access to current energy information.
Its MySite platform provides visibility into energy consumption, generation, storage, system performance, and energy cost. Users can access this information through a mobile-optimized interface.
For larger organizations, ENEE.IO’s Proteus platform provides a broader management environment that can compare energy performance across multiple locations and provide detailed reporting.
This means an energy manager can move from asking:
“How much energy did this site use last month?”
to questions such as:
“What is happening at this site right now?”
“Which energy source is currently supplying the site?”
“Has energy consumption changed?”
“Which site requires investigation?”
That additional visibility is important for operational energy management.
6. Multi-Site Energy Management
Managing one energy system is relatively straightforward.
Managing dozens or hundreds of sites is considerably more complex.
Traditional approaches may require individual spreadsheets, reports, meter readings, generator logs, and site communications to be consolidated manually.
ENEE.IO provides a centralized dashboard for organizations managing multiple sites.
Its organization dashboard can provide an overview of site status, energy consumption, energy generation, energy-source mix, costs, alerts, and emissions. Users can then drill down from the organization level to individual sites and energy assets.
ENEE.IO’s commercial solution also supports comparing site performance and generating regional or company-wide reports.
For organizations with distributed operations, this changes the management model from:
Site-by-site monitoring
to:
Centralized portfolio-level energy management.
7. Energy Analytics and Historical Data
Collecting energy data is only useful if the data can be analyzed.
ENEE.IO provides analytics that allow users to examine energy behavior and historical information.
Its support documentation describes analytics for:
- Load patterns
- Peak demand
- Energy-source usage
- Historical energy data
- Technical performance analysis
The system can also allow users to investigate historical measurements associated with specific energy assets.
This can help energy teams understand how a site behaves over time.
For example, an organization could investigate whether increased generator runtime corresponds with changes in grid availability or site demand.
Historical data can also provide a basis for evaluating changes made to an energy system.
8. Automated Alerts and Early Warning
One of the biggest operational differences between manual monitoring and automated monitoring is how quickly abnormal conditions can be identified.
ENEE.IO provides automatic alerts for energy-system conditions.
Its documentation lists alerts covering more than 40 parameters, including conditions such as:
- Battery overcharge
- Battery over-discharge
- High battery temperature
- Generator failure to start
- Grid outages
- Communication loss
- Site offline conditions
Alerts include information such as the triggering event, timestamp, affected site or device, and frequency of occurrence.
This creates an early-warning mechanism for energy-system operators.
Instead of discovering a problem during a periodic inspection, an operations team can receive an alert when a monitored condition occurs.
That can support faster investigation and maintenance.
9. Energy Cost Monitoring
Energy management is not only about kilowatt-hours.
For many businesses, the critical question is:
How much does it cost to keep the site powered?
ENEE.IO provides energy-cost information alongside energy performance.
Its MySite platform allows users to monitor energy cost, performance, consumption, and generation, while the organization dashboard can provide cost summaries by energy source.
This is particularly useful in environments where businesses use multiple energy sources.
For example:
Grid → Generator → Solar → Battery
Each source can have a different operational cost and availability profile.
Having visibility into the energy mix and associated costs can help operators make better-informed decisions about how their systems are operated.
10. Reporting Without Manual Spreadsheet Consolidation
Traditional energy reporting can require information to be collected from multiple sources and manually consolidated.
ENEE.IO includes automated reporting capabilities.
Its Energy Performance Report can provide a monthly summary covering metrics such as:
- Total energy use
- Energy-source mix
- Uptime
- Estimated CO₂ emissions
- Cost breakdown
The platform also provides reporting capabilities for multi-site organizations.
This can reduce the administrative work associated with repeatedly compiling energy information from different sites.
11. Forecasting and Energy-System Planning
ENEE.IO also extends beyond monitoring historical performance.
Its current support documentation describes forecasting capabilities that can project energy profiles over the next 12 months and provide a more detailed forecast for the next 24 hours.
The forecast can cover:
- Energy usage
- Energy cost
- Energy mix
- Emissions
The system uses historical site data and weather forecasts as inputs.
ENEE.IO also documents a system-sizing tool that can simulate the addition of solar and/or storage and estimate potential changes in:
- Total energy cost
- CO₂ emissions
- Generator runtime
This moves energy management beyond simply observing what happened toward evaluating potential future configurations.
12. Traditional vs ENEE.IO Energy Management
| Capability | Traditional Approach | ENEE.IO |
| Energy data collection | Often manual or periodic | Connected sensors and monitoring hardware |
| Energy visibility | Primarily historical | Real-time/current and historical monitoring |
| Generator monitoring | Often manual logs | Remote digital monitoring |
| Battery monitoring | Periodic checks | Continuous monitoring through connected sensors |
| Grid monitoring | Utility records/manual observation | Digital monitoring |
| Multi-site visibility | Spreadsheet/report consolidation | Centralized dashboard |
| Energy analytics | Manual analysis | Built-in analytics |
| Historical data | Manually maintained records | Digital historical data |
| Alerts | Manual detection | Automated alerts |
| Energy cost visibility | Bill-based/manual calculations | Digital cost monitoring |
| Reporting | Often manually compiled | Automated/digital reporting |
| Forecasting | Separate analysis/tools | Forecasting capabilities within platform |
| System planning | Manual modelling | Solar/storage sizing tool |
| Asset compatibility | Depends on existing systems | Designed to be vendor-agnostic |
| Access | Primarily local records | Web and mobile interfaces |
13. What This Means for Energy Managers
The fundamental difference is not simply that ENEE.IO replaces a spreadsheet with a dashboard.
It changes the way energy information is collected and used.
Traditional energy management tends to follow a cycle of:
Measure → Record → Report → Review
ENEE.IO supports a more connected cycle:
Measure → Connect → Monitor → Analyze → Alert → Act → Review
The second approach provides energy teams with more frequent information about what is happening across their energy systems.
That can be particularly valuable for organizations managing hybrid power systems, distributed sites, backup generators, batteries, solar installations, or other energy assets.
Conclusion
Traditional energy management remains useful for basic measurement and accounting, but it can become difficult to scale when organizations need detailed, timely information across multiple energy assets and locations.
ENEE.IO addresses this challenge by combining smart sensors, the eDGe data gateway, cloud-based monitoring, mobile access, analytics, automated alerts, reporting, forecasting, and multi-site management.
The key difference is visibility.
Instead of relying primarily on periodic readings and historical bills, organizations can use connected energy data to understand consumption, generation, storage, costs, system performance, energy sources, and potential issues.
For businesses operating increasingly complex energy systems, this provides the foundation for a more data-driven approach to energy management.
In simple terms: traditional energy management tells you what happened. ENEE.IO is designed to help you see what is happening, understand why, and act on the information.
Partner with DETOPSY ENGINEERING to digitize your energy infrastructure and unlock the full potential of your electrical assets with ENEE.IO.
Contact
(234) 905 023 4845
(234) 701 347 1247
[email protected]